Last Updated on July 22, 2023 by KnownSense
In this page, we delve into the intricate workings of Java Memory-Model . Whether you’re a beginner or an experienced Java developer, join us on this journey to unravel the complexities of Java Memory-Model.
In the realm of programming, memory management refers to the dynamic allocation and deallocation of objects. In Java, this responsibility is taken care of by Java itself through its automatic memory management system, commonly known as the garbage collector. Consequently, developers are relieved from the burden of implementing manual memory management logic within their applications. Java seamlessly handles memory management tasks, allowing programmers to focus on other aspects of application development.
JVM Memory Structure
JVM defines various run time data area which are used during execution of a program. Some of the areas are created by the JVM whereas some are created by the threads that are used in a program. However, the memory area created by JVM is destroyed only when the JVM exits. The data areas of thread are created during instantiation and destroyed when the thread exits.
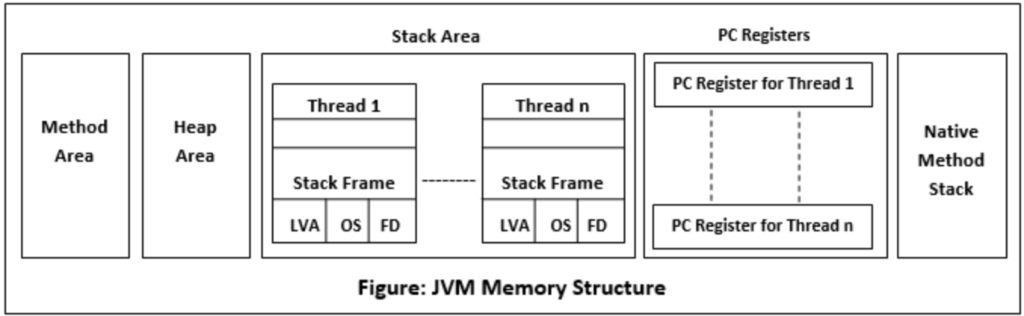
Method Area
It is a shared memory region that stores the structure and metadata of loaded classes and interfaces. Here are some key points about the Method Area:
- Purpose: The Method Area is responsible for storing the following information:
- Class level data, such as field and method information, constant pool, and method code.
- Runtime constant pool, which contains symbolic references to classes, methods, and other constants.
- Static variables and their initial values.
- Method and constructor bytecode.
- Shared Memory: The Method Area is shared among all the threads running within the JVM. It is created when the JVM starts up and is accessible to all threads executing Java code.
- Memory Allocation: Memory for the Method Area is allocated during the loading of classes and interfaces. As classes are loaded, their metadata, constant pool, and bytecode instructions are stored in the Method Area.
- Class Unloading: In certain cases, classes can be unloaded from the Method Area to free up memory. Classes can be unloaded if they are no longer reachable, such as when they are no longer referenced by any live objects or active class loaders.
- Out of Memory Errors: If the JVM cannot allocate memory for a new class or interface in the Method Area, it can throw an OutOfMemoryError to indicate that the Method Area is full.
Heap Area
Heap is a runtime data area that is dedicated to dynamically allocating memory for objects and arrays during program execution. Here are some key points about the Heap area:
- Object Storage: The Heap is where objects, including arrays, are allocated and deallocated during runtime. Whenever you create an object using the
newkeyword or dynamically allocate an array, the memory for those objects is allocated from the Heap. - Dynamic Memory Management: Unlike the Stack, which has a fixed size and supports fast allocation and deallocation of method call frames, the Heap provides more flexibility for managing memory. Objects in the Heap can be allocated and deallocated in a non-deterministic manner, depending on the program’s needs.
- Garbage Collection: The Heap is managed by the JVM’s garbage collector, which automatically reclaims memory from objects that are no longer reachable or in use by the program. The garbage collector identifies and frees memory occupied by objects that are no longer needed, allowing the Heap to be reused for future allocations.
- Memory Allocation: When an object is created, the JVM allocates memory for it on the Heap. The size of the allocated memory depends on the object’s class and instance variables. The JVM keeps track of the allocated memory and manages it efficiently to prevent memory leaks or excessive memory usage.
- Out of Memory Errors: If the JVM cannot allocate memory for new objects or arrays on the Heap due to insufficient memory, it can throw an OutOfMemoryError, indicating that the Heap is full. This typically occurs when the program is creating objects at a rate faster than the garbage collector can reclaim memory.
It’s important to note that the Heap is shared among all threads running within the JVM, and objects in the Heap can be accessed and modified by multiple threads concurrently. The JVM’s memory management system, including the garbage collector, ensures efficient utilization of the Heap and prevents memory-related issues in Java programs.
Stack Area
Stack is a runtime data area that is responsible for managing method invocations and local variables. Here are some key points about the Stack area:
- Method Execution: Each thread executing in the JVM has its own stack. Whenever a method is invoked, a new frame is created and pushed onto the stack. The frame contains information specific to that method, such as local variables, method arguments, return values, and intermediate calculation results.
- LIFO Structure: The Stack follows a Last-In-First-Out (LIFO) structure, meaning that the most recently pushed frame is the first to be popped off when a method execution completes or returns. This allows for efficient method call and return operations.
- Memory Allocation: The Stack is used for allocating memory for local variables and method parameters. Primitive data types, object references, and small objects known as “value types” (introduced in Java 15) are typically stored directly on the stack. The stack memory allocation is fast and deterministic, as the size of each method frame is known at compile-time.
- Stack Frames: A stack frame, also known as an activation record, is created for each method invocation. It contains the method’s local variables, operand stack, return address, and other bookkeeping information. As method executions complete, their corresponding stack frames are popped off the stack, reclaiming the memory.
- Thread-Specific: Each thread in the JVM has its own stack, allowing for independent method execution. This separation ensures that local variables and method invocations do not interfere with each other across different threads.
- Stack Overflow: If the stack becomes full due to excessive method invocations or large stack frames, the JVM throws a StackOverflowError. This typically occurs when there is a recursive method call without proper termination conditions or when the depth of method invocations exceeds the stack’s capacity.
It’s important to note that the stack’s memory is typically smaller than the heap’s memory allocation. The stack area is managed by the JVM and provides efficient memory allocation for method execution, local variables, and method call management in Java programs.
PC Register
It operates at a higher level of abstraction compared to physical processor architectures. Here’s some information about the PC register in the JVM:
- Bytecode Execution: In the JVM, programs are executed using bytecode, which is a platform-independent intermediate representation of Java code. The PC register in the JVM keeps track of the current instruction being executed in the bytecode sequence.
- JVM Instructions: The JVM’s PC register points to the memory address of the next bytecode instruction to be executed. It facilitates the sequential execution of bytecode instructions, similar to how the PC register functions in physical processors.
- Thread-Specific: Each thread in the JVM has its own PC register. This allows for concurrent execution of multiple threads, with each thread maintaining its own program counter for proper synchronization and thread-safe execution.
- Exception Handling: The PC register is used in JVM exception handling mechanisms. When an exception occurs, the JVM relies on the PC register to determine the appropriate exception handler or catch block to transfer control and handle the exception accordingly.
- JVM Implementation: The specific details of how the PC register is implemented can vary among different JVM implementations. JVMs may use different data structures or techniques to manage the PC register, but the underlying purpose remains consistent.
Native Method Stack
In the Java Virtual Machine (JVM), the native method stack, also known as the native stack, is a separate memory area used for executing native or non-Java code. Here are some key points about the native method stack:
- Native Methods: Native methods are methods implemented in languages other than Java, such as C or C++. They allow Java programs to interact with platform-specific or low-level operations by calling external libraries or system functions.
- Native Method Interface (JNI): The JVM provides the Native Method Interface (JNI), which serves as a bridge between Java code and native code. It allows Java programs to invoke native methods and pass data between Java and native code.
- Native Method Stack: When a native method is called from Java code, the JVM switches execution from the Java stack to the native method stack. The native method stack is used to manage the execution of native code and store relevant data, including method parameters, local variables, and return addresses specific to the native method.
- Separate Memory Area: The native method stack is separate from the Java stack and heap. It typically has a fixed size, which is determined by the JVM implementation or system configuration.
- Native Method Invocation: When a native method is invoked, the JVM transfers control to the native code. The native method can perform platform-specific operations or interact with external libraries. Once the native method completes execution, control is transferred back to the Java code.
- Memory Management: Memory allocation and deallocation in the native method stack are typically managed by the underlying system’s native code execution environment, such as the C runtime environment. The JVM interacts with the native code execution environment to allocate and free memory as needed.
Conclusion
In conclusion, understanding the Java Memory Model is crucial for writing efficient and thread-safe Java applications, ensuring proper synchronization and memory visibility in multi-threaded environments. Mastering the intricacies of the Memory Model empowers developers to optimize performance and avoid common concurrency pitfalls.