Last Updated on September 24, 2023 by KnownSense
Observability Design Principle is key for our microservices architecture because this architectural style gives you an architecture which is complex with many moving parts. Therefore, we need the ability not only to see the health of our workflows, i.e. our logical transactions, but we also need the ability to see the health of all our components, both hardware and software.
Central Logging

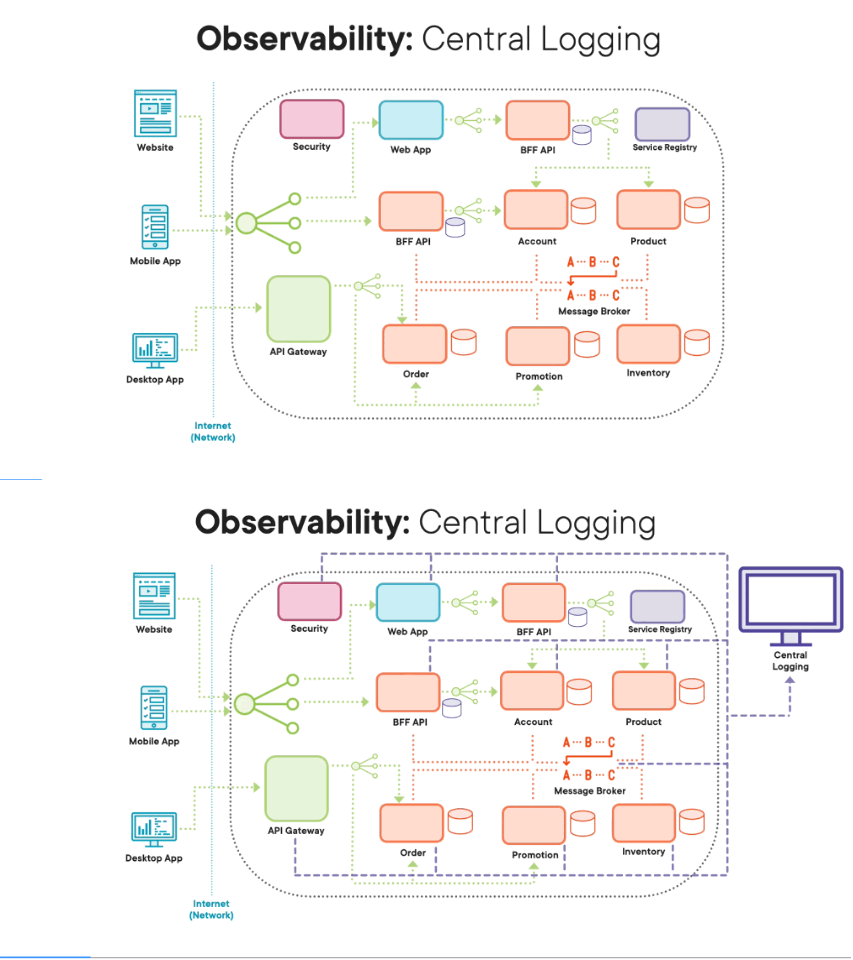
So one of the key ideas behind observability design principle is that we don’t rely on local logs for both hardware and for software. This is because when we do have a problem, be it transaction related or performance related, the last thing we want to do is search through loads of distributed log files spread across all our software architecture. Instead, we want to proactively push all our log data to a central system, to a central logging system. This logging data that we push to this central system will include everything we need in order to investigate and solve problems, problems related to workflows, i.e. logical transactions, and also problems related to performance. This logging data will include key events like requests and responses within your system, as well as messages through your message broker in your system, as well as detailed information around issues like timeout exceptions and errors within your software architecture, as well as key security events like people logging in and logging out. You will also include key events for startups and shutdowns for both hardware and software. You basically need all the data you need in order to investigate and solve any type of problem within your software architecture.
Workflow and Error Traceability

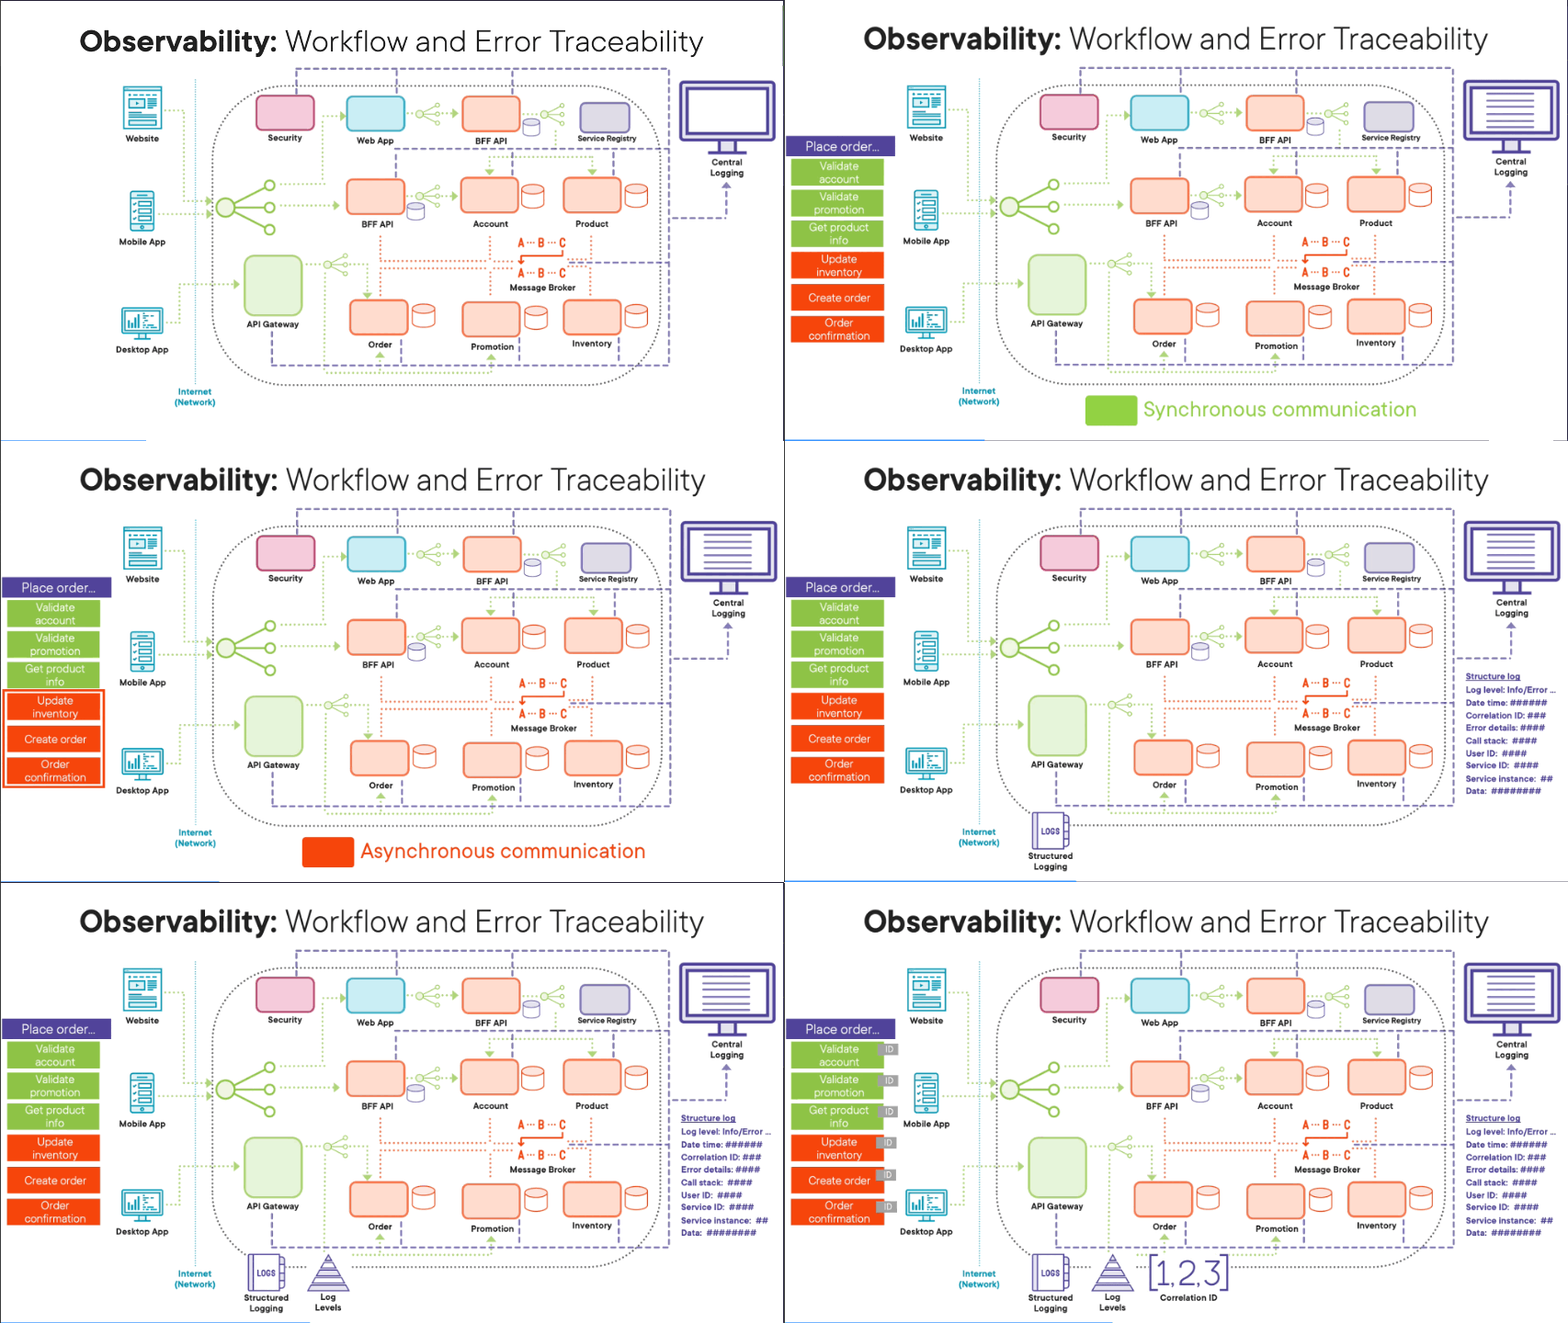
Remember, with this style of architecture, our workflows are a lot more complicated. They are logically distributed transactions where parts of our transaction, like, for example, our place order transaction are done synchronously where we wait for them to complete, and then some parts of our transactions are done a synchronously in that they are done as background tasks where we place, for example, messages on a message broker, and then those transaction parts are done in the background in their own time. Remember, this is all done to avoid a physical transaction where we wait for all parts of the transaction to complete and we end up having a user wait for ages on the client application. So the key thing here is with these complicated logical distributed transactions, we push all the data related to these transactions to a central logging system so that we can retrospectively at least trace the flow of the transactions through our software architecture. One of the key ideas is that all our microservices use structured logging in that the logging format is always consistent and the same across all our software components so that it’s easier to query the data within our central logging system. And one of the key pieces of data that we need to include with each log entry is a log level which tells us exactly what type of log entry is this, i.e. is the log entry just information, or is it data related to an error, or is it data related to a warning. i.e something’s brewing within our system? The other key thing we need to have within our log entries is a correlation ID, a unique ID that we generate at the start of every workflow. Then all our microservices involved as part of that logical distributed transaction include the same correlation ID so that we can trace that one specific logical distributed transaction across our software architecture because we have the same consistent unique correlation ID following that transaction. Obviously, in the rest of the log entry, include as much information as you can so you can pinpoint exactly where that specific event happened and what exactly happened. But remember, this is still an external data system, your central logging system, and therefore, be sensitive about the data you’re actually logging into the central database. So instead of using long descriptive data that might give information away, causing information and data policy issues, instead, use IDs that can be used to look up data in the relevant system where there are no data or information policy issues. When errors and exceptions happen within your microservices related to a transaction, include as much information as you can as part of the log entry, including exception details, including information regarding the call stack, as well as location information, like, for example, what microservice actually threw that error and what instance of that microservice it was running on what host. The key thing is we set the log level two errors so that we can at least monitor for these errors when they happen across our microservices so we can quickly and immediately resolve problems.
Central Monitoring

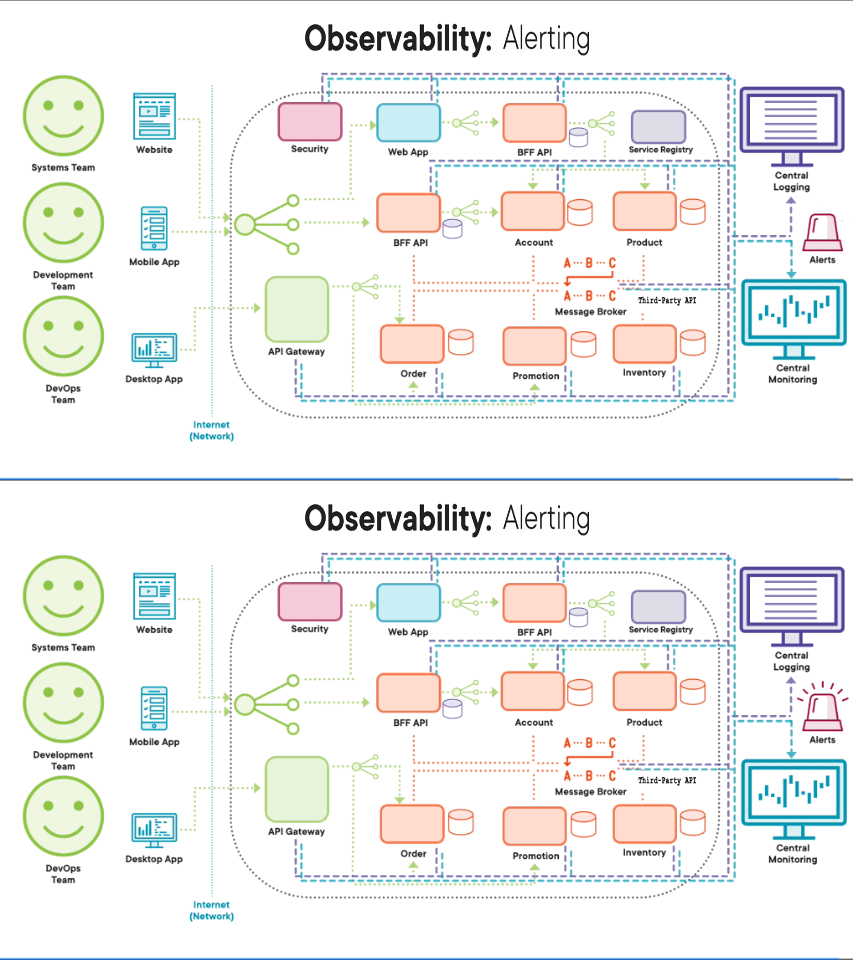
Another key part of our observability principle is that we have central monitoring, and this real‑time monitoring should also monitor for log entries that have the log level set to error so that we can immediately respond to any errors happening within our system. This idea of central monitoring just doesn’t stop there. We should have central monitoring at all levels of our software architecture stack, from networking all the way to application level, where we monitor the health of each single component involved within our software architecture stack. In microservices, we monitor for health checks. We could have special endpoints on our microservices that basically report the health of that microservice and dependencies as a health check so that when something starts showing a negative health check on our central monitoring system, we can immediately react and resolve that problem.
Capacity Planning
In addition to health checks, we also want our central monitoring system to monitor performance in terms of metrics, and these metrics can be related to all parts of hardware within our system where we monitor, for example, hosts for CPU, memory, and disk usage, but we could also use this central monitoring system to monitor the health of our network in terms of latency and connectivity issues. Our central monitoring system should also monitor metrics related to data, for example, how many transactions are we processing per minute per hour, and then it should aggregate this data and then visualize the data on graphs so that we can see exactly what our system is doing both in terms of performance and in terms of data. If there is a problem brewing, we can proactively assess the monitoring data to do some capacity planning, and we can identify emerging bottlenecks and excessive usage, and then we can scale out the relevant hardware or network components that need extra performance, or we can limit the rates of calls coming in to a specific part of our system if that’s what’s causing the issue.
Alerting

Another key part of our observability design principle and our central logging and central monitoring system is the ability to have an alerts within our system. Having Real‑time alerts that tell us that there’s a problem brewing or happening right now so that we can proactively react. These alerting features need to be full of configuration. So not only will they allow us to set tolerances, i.e. when to alert, but will give us the option to set schedules on when to alert and whom using what mechanism.
Conclusion
So hopefully from all this information you can see the observability design principle is key for our microservices architecture and key for us in terms of living with our microservices architecture. This principle occupies a pivotal role within our microservices architecture, equipping us to comprehend, navigate, and thrive within this dynamic ecosystem. It is not merely a principle; it is a lifeline. By adhering to observability, we ensure that our microservices architecture remains a resilient, agile, and responsive engine of innovation and reliability.